Take Rates
One difference in venture investing Before Covid (BC) & After Distancing (AD) is the focus on profitability - we take a holistic view on how take rates impact profitability & how can one influence it?

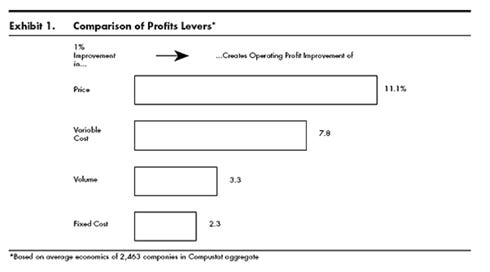
If there is one thing which has changed in #startup investing Before COVID (BC) & After Distancing (AD) (sorry for the pun) is the focus on #profitability. Profitability has had various avatars such as take rate, unit economics, margins, CM1/ CM2/ CM3 etc and different levers to influence. However, if there one consistent outcome of the research on profitability across last 3 decades, it is that pricing has a disproportionate impact on profitability (vs. any other component). For internet marketplace based companies, their pricing is determined by ‘take rates’ and so the big question is how do companies optimise their take rates to maximize profits?
Take-rate = Revenue / gross sales of your ecosystem, where ecosystems:
For Gaming = gross wager (amount contributed by players to play the game)
For Marketplace = gross merchandise volume
For Payment = gross payment volume
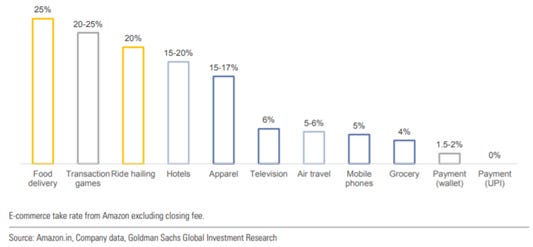
Take rates are simply the share that the marketplaces charge to enable the transaction between buyer & the seller. For e.g: Amazon charges 4% - 20% (depending on the category) take rates on various products which is included in the price that the user is paying to buy the product.
Take rates varies a lot across categories in India – from 0% - 25%
So on which factors does take rate of a marketplace depend on and what can companies do to influence it?
First, a lot depends on the industry characteristics as we saw in the previous chart, and one would be tempted to say that as a startup, one is a price follower rather than a price leader. However sometimes it is useful to think from first principles on which industry characteristics leads to higher or lower take rates & then map it to discover one’s relative differentiation vs. competition to tweak take rates to their advantage. With that in mind, let’s dive into the relationship of take rates with industry characteristics:
Online penetration of the demand side: Higher the online penetration of the demand side, that seems to be associated with typically lower take rates
Supplier fragmentation: Higher the supplier fragmentation, typically higher take rates
Below chart of online travel segments in India illustrates the first 2 points clearly
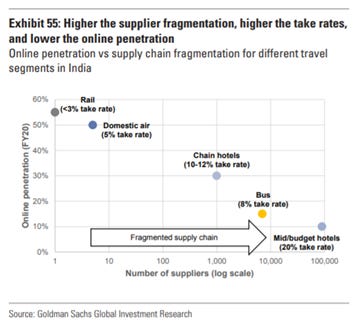
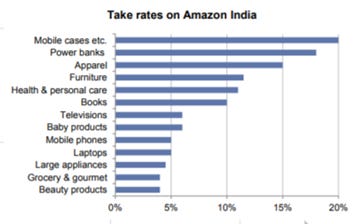
However, on a closer look of first point, % online penetration as a standalone metric doesn’t really have a relationship with take rates – to illustrate the point, one could argue that mobile accessories would have higher online penetration % vs. grocery or beauty products yet the take rates for mobile accessories is higher than both of those categories (other examples in below chart on Amazon India’s take rates). Hence, one should also look at the absolute size of that online market when looking at take rates, so a more refined relationship would be – Higher the absolute size of the online market, lower are the take rates for those categories. So equally important for online platforms to consider is offline market size in tandem with % online penetration when taking a view on take rates.
Next one is fairly intuitive, Higher the level of concentration of industry, higher are the take rates. By level of concentration we mean the share of market captured by the top players in the industry. Some Internet marketplaces do exhibit ‘winner takes most’ phenomenon & hence those industries do have higher take rates in general.
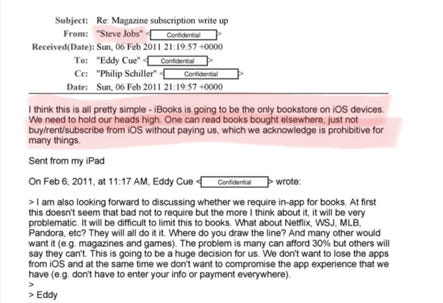
An extreme example of such a marketplace would be Google play store & iTunes (both together control 95%+ market share of smartphone Operating System (OS)) for which the take rates are high enough to be controversial – below an internal letter from Jobs (Of course, when this email was written, Apple was still a fair way away from market dominance: there were only 150-160m iOS devices in use, and iPhones were maybe 10% of all the mobile phones being used in the USA, where today they’re over 50%)
Other examples are online food delivery (Swiggy, Zomato), ride hailing (Uber, Ola) – both with >=20% take rates.
Another aspect to consider when comparing take rates is if the provider services includes demand creation or just the facilitation of transactions? If it’s the former, then most likely one could look at higher take rates than the latter case (e.g: facilitate financial transactions)
While all the aspects listed above is true for an industry under consideration, startups could look & measure where their value proposition is stronger vs. competitors within the same industry w.r.t the above listed parameters & ‘tweak’ take rates accordingly to optimise for profitability. Some of the other thoughts on looking at optimising take rates for the company:
Auction based take rates: Start with a low take rate to get broad-based supplier adoption, and add in a market-driven pricing dynamic that allows those suppliers who want more volume or exposure to pay more on an opt-in basis. When prices go up due to bidding and competition, the suppliers blame their competition not the platform – classic example is the Google Adwords business model here. This also allows the platform to extract more dollars from those suppliers who desire to spend more to promote themselves (without raising the tax on those that don’t). For more refer to this piece from Bill Gurley
Take rate as form of consumer/ supplier ‘friction’: Ideally any founder wants to build a platform that has the least amount of friction (both product & pricing). High rakes are a form of friction precisely because the take rate becomes part of the landed price for the consumer. If one charges an excessive rake, the pricing of items in the marketplace are now unnaturally high - High rakes also create a natural impetus for suppliers to look elsewhere, which endangers sustainability.
Advertising as take rate: Should the market place also take into consideration the advertising monies they charge from suppliers as a way of enhancing take rates? Clearly, most of the horizontal market places are now some of the biggest advertisers in the market – e.g: Amazon & Flipkart are taking the largest share of digital advertising budgets after Google & FB in India.
Finally, I like the way Bill Gurley puts it, “A sustainable platform or marketplace is one where the value of being in the network clearly outshines the transactional costs charged for being in the network. This way, suppliers will feel obliged to stay on the platform, and consumers will not see prices that are overly burdened by the network provider”.
Today, however, as individual professionals, the clearest form of "take rate/ rake" in each of our lives is taxes paid to the government. Anywhere between 15% - 45% of your hard-earned income goes to the government which is nothing but a take rate government is charging for running the largest democratic ‘marketplace’ in the world. But clearly, there is an issue in user adoption i.e they aren’t able to get many users, only 1.2% of Indians pay income taxes. Reasons for that are partially the average per capita income in India but also because of the various dis-incentives that government provides to tax payers. But that is for another day, another post! Stay tuned & share your thoughts?